
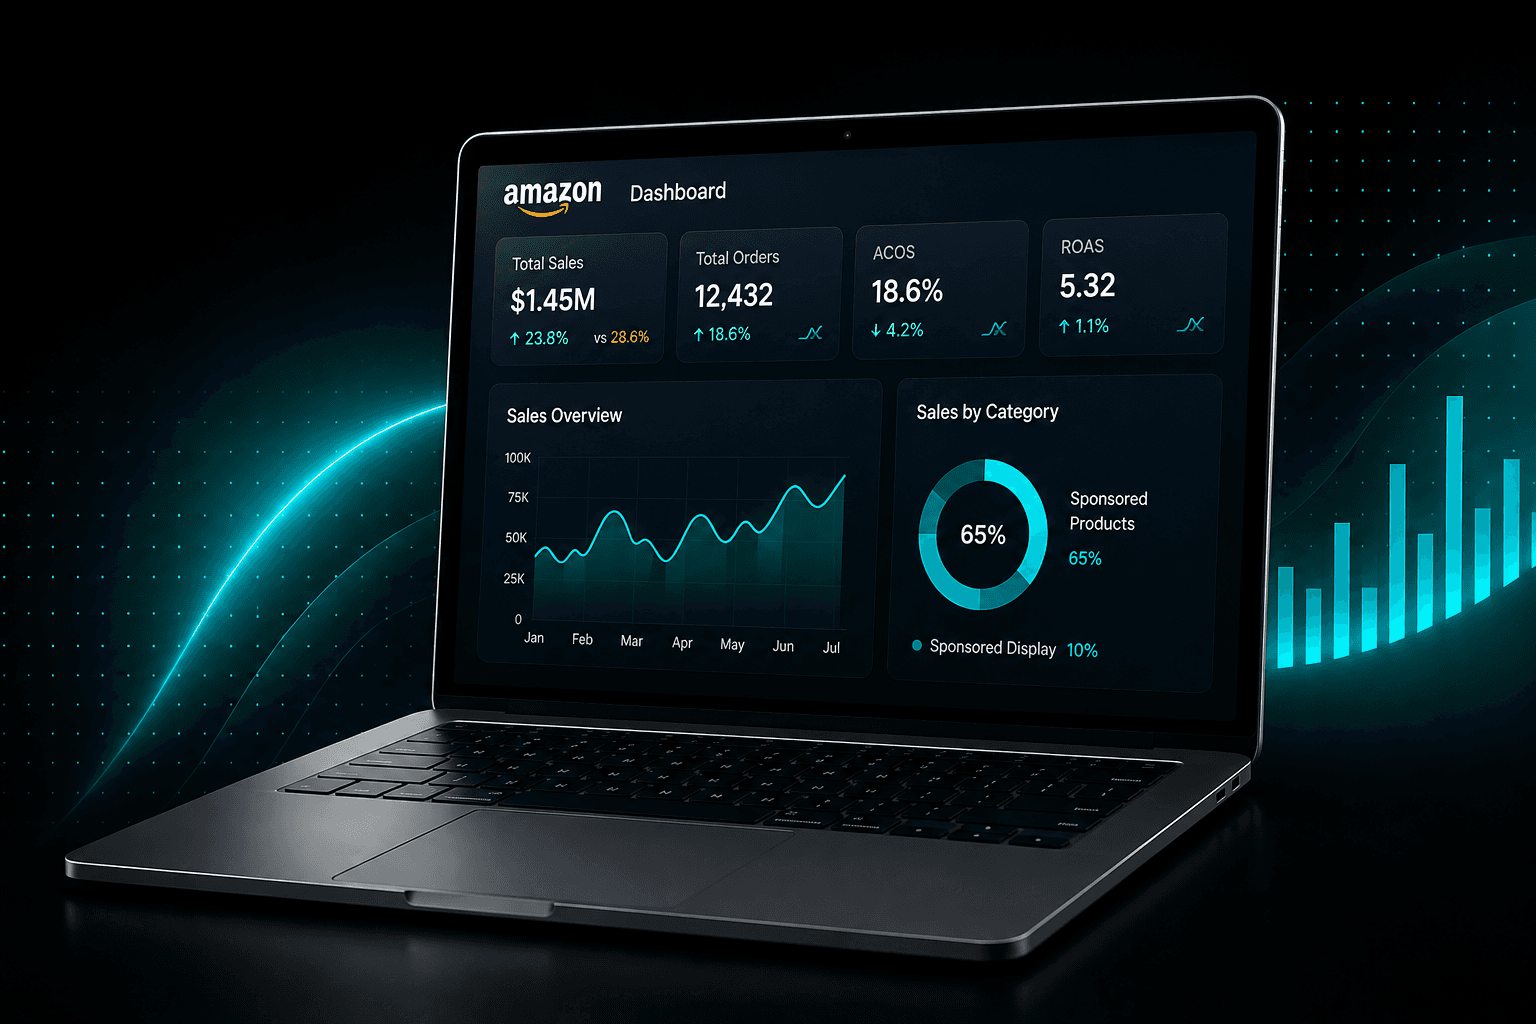


Amazon ACOS and TACOS answer different questions. ACOS measures whether ad-attributed sales justify advertising spend. TACOS measures how heavily the entire Amazon business depends on that spend. Established brands should track both because a lower ACOS can hide declining organic sales, while a higher ACOS can be acceptable during a controlled growth period.
Amazon defines ACOS as ad spend divided by ad-attributed revenue:
ACOS = Ad spend / Ad-attributed sales x 100
TACOS uses total sales instead:
TACOS = Ad spend / Total Amazon sales x 100
Suppose a brand spends $10,000 and produces $40,000 in ad-attributed sales plus $60,000 in organic sales. ACOS is 25%, while TACOS is 10%. The 25% ACOS describes campaign efficiency. The 10% TACOS shows that every $1 of total revenue required $0.10 in advertising.
1. Read the direction of both metrics
The weekly movement matters more than either percentage in isolation.
- ACOS down, TACOS down: advertising efficiency and overall sales mix are improving.
- ACOS down, TACOS up: ads are efficient, but total sales are weakening or ad dependence is rising.
- ACOS up, TACOS down: advertising is less efficient, but total sales or organic sales are growing faster.
- ACOS up, TACOS up: advertising efficiency and total-sales productivity are both deteriorating.
The third scenario often appears during ranking pushes. A brand may accept a temporary ACOS increase if ads help expand total sales and TACOS stays controlled. That does not prove ads caused organic growth, but it is a useful signal to investigate alongside organic rank, branded search volume, and new-to-brand sales.
2. Set the target from contribution margin
There is no universal “good ACOS.” Amazon states that the right target depends on factors such as margin and campaign objectives. Start with pre-ad contribution margin:
Pre-ad contribution margin = Selling price - Amazon fees - landed product cost - variable operating costs
If a product sells for $50 and contributes $15 before ads, its break-even ACOS is 30%. An ACOS above 30% loses money on the attributed order unless repeat purchases or other measurable downstream value justify the acquisition cost.
The operating target should sit below break-even. At a 24% target ACOS, the same $50 sale allows $12 in ad spend and preserves $3 in contribution after advertising.
3. Diagnose changes with a five-line weekly review
Track total sales, ad spend, ad-attributed sales, ACOS, and TACOS for the same date range. Then add conversion rate and average selling price to explain movement.
Track Weekly:
- Total sales
- Ad spend
- ACOS
- TACOS
If ACOS rises, determine whether CPC increased, conversion rate fell, or the sales mix shifted toward lower-priced products. If TACOS rises while ACOS improves, inspect organic sales and branded demand before celebrating the campaign result. A discount can also improve ACOS while reducing contribution dollars, so confirm margin after promotions.
Pro Tip:
Do not optimize ACOS by simply cutting spend. Pausing discovery campaigns can make the account look more efficient while shrinking total sales.
Judge each campaign by its job: branded defense, category growth, product launch, ranking support, or profit harvesting.
Key Benefit:
ACOS tells the media team what happened inside advertising. TACOS tells the brand manager whether advertising is supporting a healthier business.
4. Use a monthly decision record
At month-end, record the target, actual result, explanation, and next action for both metrics. For example: “ACOS increased from 22% to 26% because non-branded discovery spend expanded; TACOS declined from 11% to 9% as total sales grew faster than spend.”
That note preserves the business context behind the percentages. It also prevents the team from reversing a deliberate growth investment simply because a dashboard shows red week-over-week movement. Assign each material change to a campaign, product, price event, or inventory event whenever the data supports that link.
Source: Amazon Ads guide to ACOS